
Even a dead cat will bounce if it falls from a great height...
Tuesday, May 31, 2011
Equity Wrapup 5/31
Russell 2000 Index (TF) Last Hail Mary? 5/31

Crude Oil (CL) Short opportunity 5/31

Natural Gas (NG) Daily 5/31

Interesting Volume Spike in SOXS (3x Bear Semiconductor ETF) 8:55AM CST 5/31
Interesting note:
SOXS, a 3x leveraged bearish semiconductor ETF, has done just under 100k contracts in volume already today (much of it at the lows near 54.50.
Is this the smart money making a bet that equities are poised to finally hold here and start to make a leg lower?
SOXS, a 3x leveraged bearish semiconductor ETF, has done just under 100k contracts in volume already today (much of it at the lows near 54.50.
The daily average is 130k contracts a day. We are on pace to go way above that.
Is this the smart money making a bet that equities are poised to finally hold here and start to make a leg lower?
(UPDATE: 930AM CST - SNP500 is 50% from it's highs at 1337 and SOXS has now done 112k contracts 1 hour into the trading session we are 18k from daily volume avg.)
Crude Encountering Resistance? 5/31 8:20AM CST


(Chart 1 - WTI Crude Daily chart zoomed in)
(Chart 2 - WTI Crude Daily chart)
(Chart 2 - WTI Crude Daily chart)
103.40-103.00 is very good resistance for WTI crude. We have a confluence of 2 Fibonacci levels here, as well as the top of the current bullish channel just a bit higher.
Monday, May 30, 2011
Short Entry on EUR/USD? 9:00PM CST 5/30


(Chart 1 - EURUSD 60 min chart zoomed)
(Chart 2 - EURUSD 60 min chart)
(Chart 3 - EURUSD Daily w/ minor MML drawn)
(Chart 4 - EURUSD Daily w MML drawn)
1.4400-1.4425 is very strong resistance in the EUR/USD both short term and intermediate term. This recent bailout news got us to 1.4415 and closed at 1.4398 on the 8-9PM hour bar. I like selling the open of the 9PM bar (1.4399) for a move down to 1.4075 and ultimately 1.3675.
Be conservative in your sizing and liberal in your stop. This trade might be subject to 1 or 2 lurches and shakeouts with new highs on low volume before it makes its move for those targets.
You can always sell more once its makes its move and has a pullback.
(Note: If you see high volume doji and/or shooting stars in the 1.4400-1.4430 area on a small time frame chart, consider using that as your entry if you want to wait for one of those instead of just selling right here right now. Might not see one, but if you do, will be a much higher probability setup)
SnP Day Trader Road Map 7:45PM CST 5/30

 (Chart 1 - Snp 60 min chart zoomed)
(Chart 2 - Snp 60 min chart)
I will be publishing a "Day trader road map" every evening for a few products. This should give key S/R levels on a more micro basis, as well as highlight possible plans for the days trading.
Here we have a 60 min chart of the SnP mini future (Jun11 contract) (NOTE: For all those who don't know what that is, consider it a fine proxy for the SnP index itself, or the .SPY ETF.)
For today's trading, 1335-1340 should provide resistance. Personally, I would fade this zone on the sell side, and take some down to 1329 with an ultimate target of 1321.
Combine that with that MACD divergence we have over the last 25-30 sixty minute bars, and I think strength can be sold with good confidence.
Should we get above 1340, the buy case most likely is in effect, but we will cross that bridge when we get there.
(Edit: Daily Canary has good unique overbought/oversold indicator posts about the Dow. Use them to further make up your mind)
Russell 2k At Key Resistance. 5/30 7:00PM CST


 (Chart 1 - Russell2k Daily Chart Zoom)
(Chart 2 - Russell2k Daily Chart)
(Chart 3 - Russell2k Weekly Chart)
8420 should provide very strong resistance and seal in the dead cat bounce of this previous week. We should be headed lower very soon.
There is the head and shoulders breakdown in this resistance cluster (8420-8780) of the daily chart.
There is also the weekly chart with its most recent large wick hammer. Normally those are very bullish. However, this one smells like a trap. Set upon the already bearish technical picture for the rus2k, we see a few key things about this hammer.
-We have had a large down push, a gravestone doji, and a spinning top, all on very good volume the 3 prior weeks which ultimately pushed us under the 8420 level. This last week we went much lower, but ultimately retraced it all and finished with a hammer high just under 8420. This hammer was on 527k contracts traded. The 3 selling weeks prior were on roughly 700k+ each. For such bold price action as this hammer showed, the volume suggests it is the last swan song of the BTFDers (buy the fucking dippers) as we head lower to 7820 and ultimately 6250.
Gold Going Higher? Daily Chart 5/30 6:45PM CST

 (Chart 1 - Gold Daily Chart Zoom)
(Chart 2 - Gold Daily Chart)
If gold can get back down through the support zone that it just broke out of (1501-1464), then I think it will fall to 1350. If that fails it is headed to 1200.
However, I still think given the way it acted when in the 1501-1464 zone most recently, we are headed up. I think any test of the 1520-1480 area can be used to buy and accumulate a position for a scalp to 1560 and an ultimate target of 1615. You are wrong if it trades convincingly under 1464.
NZD/USD New all time highs 5/30

EDIT: Just to note, not a big fan of this trade unless we see a pullback to the .8 area, if so then I feel its buy buy buy.
Friday, May 27, 2011
Equities weekly wrap-up 5/27

USDCHF Update 5/27

Equities volume analysis 5/27

Here it is, my first ever blog posting as requested! :) Again the Delta Vol shows continue selling on both index. This is why I am still bearish from my inital positon on the russell at 838.40. Of course as everyone know, using vol analysis for your trading can change at anytime when supply and demand comes in. You do not know when but you need to be able to react to it quickly. As of right now, I am still bearish and think this morning was a mark up. Of course this can change if Vol picks up or the bears give up near end of day, but hints of it will show up in the chart. I hope this help. I'm just playing the odds and managing my risk with a trailing stops. FYI... i hate this market btw with the FED being involved. Its not the same anymore these day...... good luck!
PS: Since this is my first ever post, I had to remove some charting items for legal purpose. Just being truthful just in case one of you ask. :)
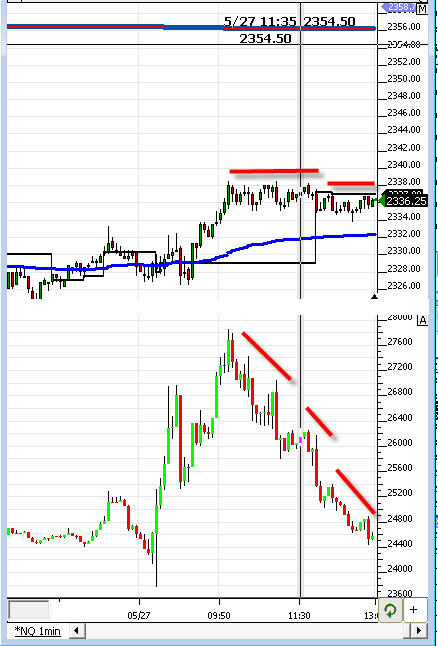
Nasdaq (NQ) Intra-day report 5/27

WLT Walter Energy update 5/27

Euro bumping on trendline 5/27

Edit: The awful housing number that just came out seems to have maybe given us an engulfing pattern to look into selling the euro here for at least a small gain.
Corn (ZC) Second opportunity? 5/27

Thursday, May 26, 2011
Nasdaq Constant Volume Bar 8:15PM CST 5/26


If you follow this, you know I am bearish the Nasdaq. See any of my recent posts such as this one. I will be the first one to tell you when I am wrong on something I said. I post all my pukes and make no bones about any of it...
That being said, I am still short this fucker and still think it is ripe to fall. I sound like a broken record, but sometimes you have to trust what you know to be right. Lets go to this constant volume chart (which plots each bar as the range price traded in for 5,000 contracts).
We have a confluence of resistance at the 2330-2340 area:
-Top of current magenta dominant bearish channel
-Bottom of old dominant orange bearish channel
-38% shallow Fib from May 2 highs to recent May 24th lows
If we can get above both of the aforementioned channel lines, I will wave the white flag.
Until then, I am holding.
WTI Crude Between a Rock Support and a Hard Resistance 8:00PM CST 5/26


Using a "constant volume bar" study (which plots each bar as the range price traded in for 10,000 contracts to trade), we have the following chart. We can see that the midpoint of the blue bullish channel has been an important level. The top of the bearish magenta channel is also key. These 2 levels are colliding in the next few 10k trades. Just underneath is $100, which as you can see has been very important as well.
I scratched my sell at $100 and am waiting to see how price breaks out of the current triangle it is in. I am betting on supply coming in at the top of the triangle and crushing it through $100, but time will tell.
Equities moving up, Russell 2K leading way 5/26

Last Swan Song for Nasdaq Shorts.... 11:55AM CST 5/26


Still like being short (and still am), but it's now or never for them to work.
Price got back to the lows of the old bull channel (yellow)
We are also right back into the 50 (blue) and 100 (yellow) day VWAPs
Combine all this with 2327 being the 50% from May 19 high to yesterday's lows.
Sell right here, but a close over 2330-2335 and you should be out.
Ebay possible buy opportunity 5/26

Stock Account? ETFs please
So in case you were reading our suggestions and thinking, well all I have is my TD Ameritrade account or whatnot, how am I supposed to be buying into all these markets? Well, ETFs to the rescue. From investopedia for those who dont know an ETF is:
"A security that tracks an index, a commodity or a basket of assets like an index fund, but trades like a stock on an exchange. ETFs experience price changes throughout the day as they are bought and sold. "
You can almost find an ETF for anything out there and etf stock encyclopedia is one of my favorite sites for this. Just beware that most ETFs slowly lose value over time and you should always research the exact holdings of what they invest in. So Goodluck trading.
Natural Gas (NG) Bearish Number BTFD? 5/26

 After a bearish number for the natural gas storage (more than expected in storage at 105B vs expected 93B), we saw a sharp sell off. I think its is a great opportunity to BTFD and get in on this trade suggested in an earlier post. We see on the daily chart the confluence of retracements at the 4.325-4.312 range. While currently its just under this, it has held its recent uptrend's retracement. I think this holds well and we see a move back to its hights today in the 4.45-4.48 area. Everything else about this trade still looks great and the initial entry signal was a good one so far. So I've said it once and ill say it again, by that fucking dip
EDIT: just in case you are wondering, you can play NG in the stock ticket UNG (United States Natural Gas Fund) or in Direxion Daily Natural Gas Related Bull 2x Shares ETF (FCGL)
Crude Oil (CL) Indecision continues. 5/26

Dolemite Pre-Open Position Update
I resold EuroUSD as posted here.
I am still short my 2 packages of semi conductor stocks (long SOXS) as a way to play being short Nasdaq. The reasons are here
I am still short my 2 packages of semi conductor stocks (long SOXS) as a way to play being short Nasdaq. The reasons are here
I am still short crude (though I am white knuckleing it a bit)
High today was 101.90. If we crack 102 I am out and will look to resell at 103-104
High today was 101.90. If we crack 102 I am out and will look to resell at 103-104
You can read our recent crude thoughts here.
Good Entry to Sell Euro? 8:00 AM CST 5/26


After being wrong about selling 1.41, I am going to put my hand to the stove again. I sold after the 15 minute bar from 7:45-8 AM CST formed that shooting star. The MACD also had divergence(yellow lines). Combine this with this shooting star forming at the 62% fib level of the most recent real down move and I think this is a low risk entry. A real move over 1.42 changes my thesis.
30 Yr. Treasury Future To Resume Uptrend?


Having broken through the Fibbonacci zone at 12416-124-20, it will now provide good support, as the long bond tries to complete it's move to the top of it's bullish channel near 126 and ultimately to the Fibbonacci resistance just under 127. As evidenced by the May 19th daily chart hammer, a support zone has been established at 12416-12420. The overnight action of today's session confirmed this. Dips into this area can be bought.
Wednesday, May 25, 2011
Dollar Index (DX) Possible Trend Change 5/25

Crude Oil (CL) End of Day Report 5/25

Euro End of Day report 5/25

Nasdaq Mini Future End Of Day Macro Charts 5/25


Yesterday, I said the 2320 level would be significant resistance. Today's short covering melt up in the afternoon stalled in the very same area and came off it pretty good. I was scared a little bit watching my shorts get hammered today, especially when I added to them at 2307, but the last hour of the session calmed me down. Looking at it now, today was a proverbial dead cat bounce. Sell the pops, Nasdaq is headed to at least it's previous support of 2280, and most likely lower, to the bottom of the bearish magenta channel. If the Nasdaq can close back into the old bullish channels above it (blue and light blue) I will change my tune. Until then... STFP (sell the fucking pop)
SnP Mini Future End Of Day Macro Charts 5/25


Wow.... what a session. After a complete meltdown during the Asian hrs, we retraced it all the way and ended up pushing new highs for much of the day. High of the day stalled at the 50% retrace (1325) from the highs of May 19th, to the lows of today. This is also the 38% from the Japan lows to the May 2nd highs which was good support, and is now resistance.
As long as we don't penetrate today's high, I still feel rallies can be sold for an eventual test of the 1290-1300 support area. Any close over 1325 and all bets are off.....
Subscribe to:
Comments (Atom)