Wednesday, June 1, 2011

EURUSD update 11PM CST 6/1


(Chart 1 - Euro/USD daily chart w/ MML resistance drawn)
(Chart 2 - Euro/USD daily chart w/ mMML minor resistance drawn)

I think risk off (aka dollar on) is in effect for a bit.
Euro stayed put all day as stocks got mauled...
Then at like 1 or 2 PM CST it as well as gold oil and other dollar bell weathers got hit.

14405-14424 was key resistance. We got above it and then battled it all day, and at one point even made me think we might go higher in the face of the stock bloodbath.

Once it snapped back under 144, I felt like the short was the right side again, and the close only confirmed it.

I like selling pops today and fading into a short position.
I could see them trying to gun weak shorts out, as it looks like a good sale right now.
14400-14425 should be key resistance again...

Short term targets of 14310 and 14250 and ultimately 14160
(Again, for what Murrey math lines (MML) are, please
google them for some info)

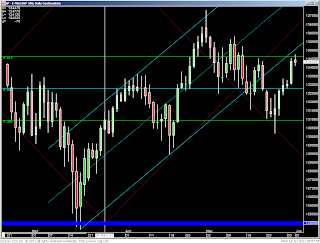
SNP Wrapup 5:40 PM CST 6/1


(Chart 1 - Snp day chart zoom)
(Chart 2 - Snp day chart)

Wow... what a day.
We came up to 1348, hit the top of the trading range and the bottom of the very important old bullish channel, and fell like a stone.

2.67 million contracts traded across all SNP futures (On the very high side)
CNBC had to pull every excuse out of the 'o8 bag for why we were down.... (Can't be because stocks are shit and smart money is dumping...)

1346-1310 is the "trading range" of this area(1250-1406). When we are inside it, we want to stay there. When we are outside of it, we have a hard time getting back in. (This and a lot of these funky lines and grids are part of Murrey Math Lines, which you can Google. I have the book which has info not on any site or forum.)

That being said... we are at 1311 currently. I took a scratch on some of my shorts 3/4 of the way of that sell off. Still short quite a bit. I am looking for buying off the 1310 to push us up into the Asian and European sessions, maybe even the US. We have NFP Friday, so it might take the release of the jobs number to get us through this 1310, and will be a dead cat bounce from now until then... Just means I can sell some more ;)

Oh as for targets and contingencies.... If we crack 1310, 1290 is short term and 1250 is ultimate support. If we bounce from 1310 I am looking to sell 1327 and 1343 with a stop of 1350.

Score One For The Bad Guys ;)

After hanging on for dear life this last week and telling the market "we are right no matter what you try to make us think" today wiping out the past 5 sessions of buying certainly feels good.

Roar on you crazy diamond (bear)!!!!!

Crude Oil (CL) / Russell 2000 (TF) Daily 6/1

Crude oil on the left chart, has fallen off hard after testing the trendline in yellow and just breaking above the 38.2% retracement at 102.35 yesterday. It has nearly engulfed yesterdays move and as long as we finish here I can see this heading back to the 98-97 levels by end of the week. As for equity markets, the Russell 2000 leads the way down today as the divergence pointed out in yesterday's post seems to have come through. Three out of four of the equity indexes that we regularly post about have engulfed at least yesterday's move (nasdaq not quite, but close as it lags behind) and look to erase yesterday. While in earlier posts I had thought a retrace back to channel highs for equities was very possible, yesterday was a surprise, and hopefully it will just be a forgotten memory soon.

Natural Gas (NG) Daily 6/1

If you had taken my suggestion to get long natural gas in previous posts, and also saw my thoughts on where to take profits, well then listen here. Looking at a zoomed out daily chart of natural gas, it looks like its running into a previous trendline right here (@4.7, shown in yellow) and may be headed back to the lower area of this channel formed by the lower yellow line. I think this is as good of place as any to take all profits and wait for a pullback to get back in.

USDCAD / AUDUSD Daily 6/1

Looking at the two currencies, I think these are both primed to continue their major trends, down for the USDCAD and up for the AUDUSD. We see some strong continuation divergence (shown in yellow) off the MACD in the USDCAD while it stays contained in the 61.8% retracement shown in purple. While the AUDUSD is not quite divergence in the sense of the MACD and price heading in opposite directions, but you can see the dramatic angle between the slopes of the yellow lines, along with it bouncing off the 38.2% retracement in purple. So once again I like selling usdcad and buying audusd.

EURUSD Morning Update 6/01 7:06AM CST 6/1


(Chart 1 EURUSD Daily Chart Zoom)
(Chart 2 EURUSD Daily Chart)

Euro up against bottom of its trading range (14425) and the 50% of its may 4th high to May 23rd low (14444).

Halfway through the session we have formed a shooting star right off of this resistance cluster.

I think the short game is still in play unless we close over 14500.

See my previous EuroUSD post from the weekend HERE for aditional color.

SNP Mid Day Update 7:00AM 6/1


(Chart 1 - Snp Daily Chart Zoomed)
(Chart 2 - Snp Daily Chart)

1310-1346 is the trading range.
The light blue up channel was the dominant S/R.
Now that we are out of it, we are back against the bottom of it, as well as the top of the trading range.

If we can close inside the blue channel, I am a buyer.
If we reject it and close inside of 1346, I am a seller.

Are the winds of change blowing? Or will it be more 2PM 10 point melt-ups?