Friday, February 3, 2012

Stock Top In?


Please do not take this post as a signal that we are starting up again... I just feel very strongly about it and want there to be a record...

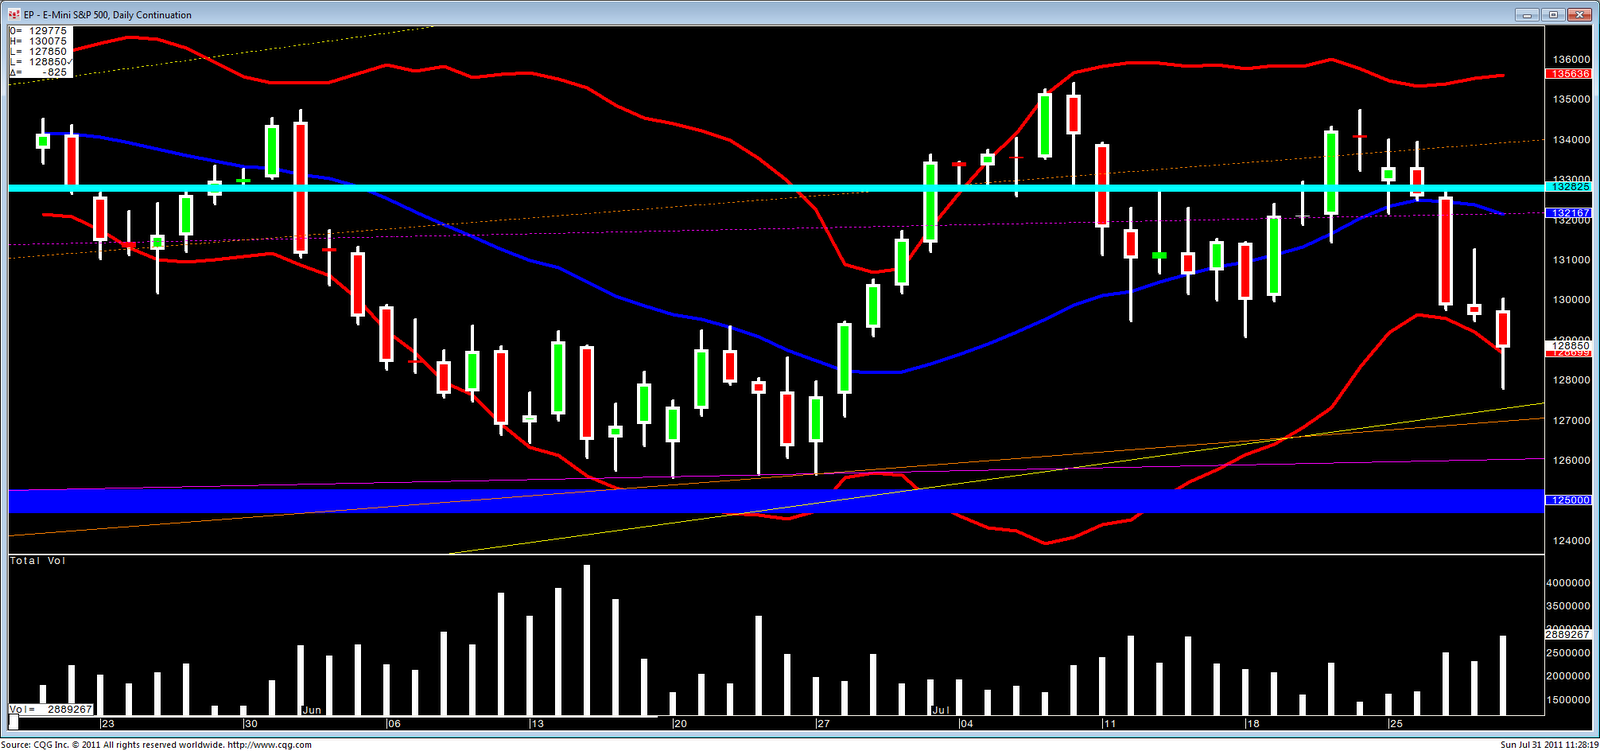
The SnP daily chart has come up for a 2nd test of this strong harmonic sell zone and for the last 3 sessions still can't break through to the upside
This bearish butterfly pattern is completed to near perfection (see attachment)
The shooting star candle bar, a strong reversal price action indicator, on Jan 26 was also on high relative volume, which is always good.
(Bill gates sold $450 million worth of MSFT around here too lol)


I love the risk reward here selling before NFP with a 10 handle stop
If I am right, we go to 1300 initially, but 1265 would be my profit target unless I saw real strong support at 1300
I would love to sell enough that I can take half of it off at 1300 and move my stop to breakeven for the rest

I am writing before NFP, but I feel it can only disappoint the market


Sunday, July 31, 2011

Crude Oil (CL) Uptrend held? 7/31

To the left is a 4 hour chart of crude oil. Over the last couple weeks we have been in a pretty slow grinding up trend, with higher highs and higher lows for the most part. After spending more than the average amount of time hovering around 100$ a barrel, we then saw a larger than average sell off. It appears though that we have held the previous low to this point. We can also see divergence with the MACD average in the long term (shown by the purple lines) and the histogram in the short term (shown by the yellow lines). We also saw a lot of volume stepping in when we reached the 50% retracement of this recent uptrend shown in green. I think this is going to be a good spot to buy to try to get back to 100$ a barrel.

Silver (SI) breaks into retracement channel 7/31

Silver's daily chart to the left, and as we can see over the last two weeks we have finally broken past the strong resistance formed right around 39 (shown in purple) by the 38% retracement of the march may meltdown. Now that we have gotten into this retracement channel between 39 and 43, I see it as a high possibility that we bounce here back up to at least 43. I think on a long term outlook, I would be looking to buy anything near 39 to play towards the topside of the channel.

Gold Look at the Week Ahead 7/31


(Chart 1 - Gold Daily SStoch, RSI, MACD Divergence)
(Chart 2 - Gold Daily Zoom)
(Chart 3 - Gold Daily)

Compare chart 1 to the price action on charts 2 and/or 3.
See how the momentum indicators in chart 1 make lower highs as gold makes higher highs in price at the same time?
This is a sign of impending weakness.
Furthermore with this point, SStoch and RSI are both in traditional "overbought" territory (+80 and +75 respectively).

One can also see that gold is governed by 3 bullish channels.
We are in the top 1/4 of all 3, which is an additional measure of being overbought
Furthermore, the latest daily bar has a nice upper wick after stalling at the 1640 resistance

Based on all this, I would say gold is a sell here. However, I usually like to have a nice shooting star in the price before I go short. I would sell here if you are aggressive with a 1650ish stop. I would sell a break of 1609 if you are conservative.

If this is indeed a top for the moment, then I expect price to fall to 1562.5 initially, and 1480-1500 finally.

SNP Look at the Week Ahead 7/31


(Chart 1 - SNP Daily Extra Zoom)
(Chart 2 - SNP Daily Zoom)
(Chart 3 - SNP Daily )

Looking at the charts, I see 3 important bullish channels that can be governing current price. Using principles from the VSA bible "Master the Markets" (google it if you have never heard of it), and applying them to any of these channels, we can define the SNP as oversold.

This is bullet point number 1. We can further our bullish case by looking at the price action vs. volume on Friday. Although not a true hammer, we had price move well past the 2nd stnd. deviation (red Bollinger Band), and then close inside of it. This happened on far more volume than any of the previous days.

Based on this, and assuming this Debt Ceiling crap doesn't throw a giant curve ball in the next few days (which is a big "if" lol), I see this as a buying opportunity for a move up to the 1328 area.

Sorry for the Lapse in Coverage

Sorry for the absence guys...
Sandwich had some personal stuff to take care of and I was busy as hell at work.
However, we should be back to posting a few things a day going forward.

-Dolemite

Tuesday, July 19, 2011

Dollar Index (DX) Ascending Triangle 7/19

To the left is a daily chart of the Dollar Index (DX). I decided to do a second post to Dolemite's because we get different continuation charts based on the software we use, so sometimes different viewpoints can be seen. After reaching our lows @72.86, we seem to have been forming a strong ascending triangle. Each rally has rejected the lowest fib retracement (shown in purple) of the prior down move and every move down has made a higher low, creating a strong trend line (shown in yellow). Usually these resistance / support areas attract the price and it looks like we might see the dollar get down to the 74.9 area over the next couple days, but in the end I feel this type of formation breaks towards the upside and we will see a dollar rally that can actually break the 38% retracement level around 76.25 and hold it.