
Even a dead cat will bounce if it falls from a great height...
Sunday, July 31, 2011
Crude Oil (CL) Uptrend held? 7/31
Silver (SI) breaks into retracement channel 7/31

Gold Look at the Week Ahead 7/31


 (Chart 1 - Gold Daily SStoch, RSI, MACD Divergence)
(Chart 2 - Gold Daily Zoom)
(Chart 3 - Gold Daily)
Compare chart 1 to the price action on charts 2 and/or 3.
See how the momentum indicators in chart 1 make lower highs as gold makes higher highs in price at the same time?
This is a sign of impending weakness.
Furthermore with this point, SStoch and RSI are both in traditional "overbought" territory (+80 and +75 respectively).
One can also see that gold is governed by 3 bullish channels.
We are in the top 1/4 of all 3, which is an additional measure of being overbought
We are in the top 1/4 of all 3, which is an additional measure of being overbought
Furthermore, the latest daily bar has a nice upper wick after stalling at the 1640 resistance
Based on all this, I would say gold is a sell here. However, I usually like to have a nice shooting star in the price before I go short. I would sell here if you are aggressive with a 1650ish stop. I would sell a break of 1609 if you are conservative.
If this is indeed a top for the moment, then I expect price to fall to 1562.5 initially, and 1480-1500 finally.
SNP Look at the Week Ahead 7/31
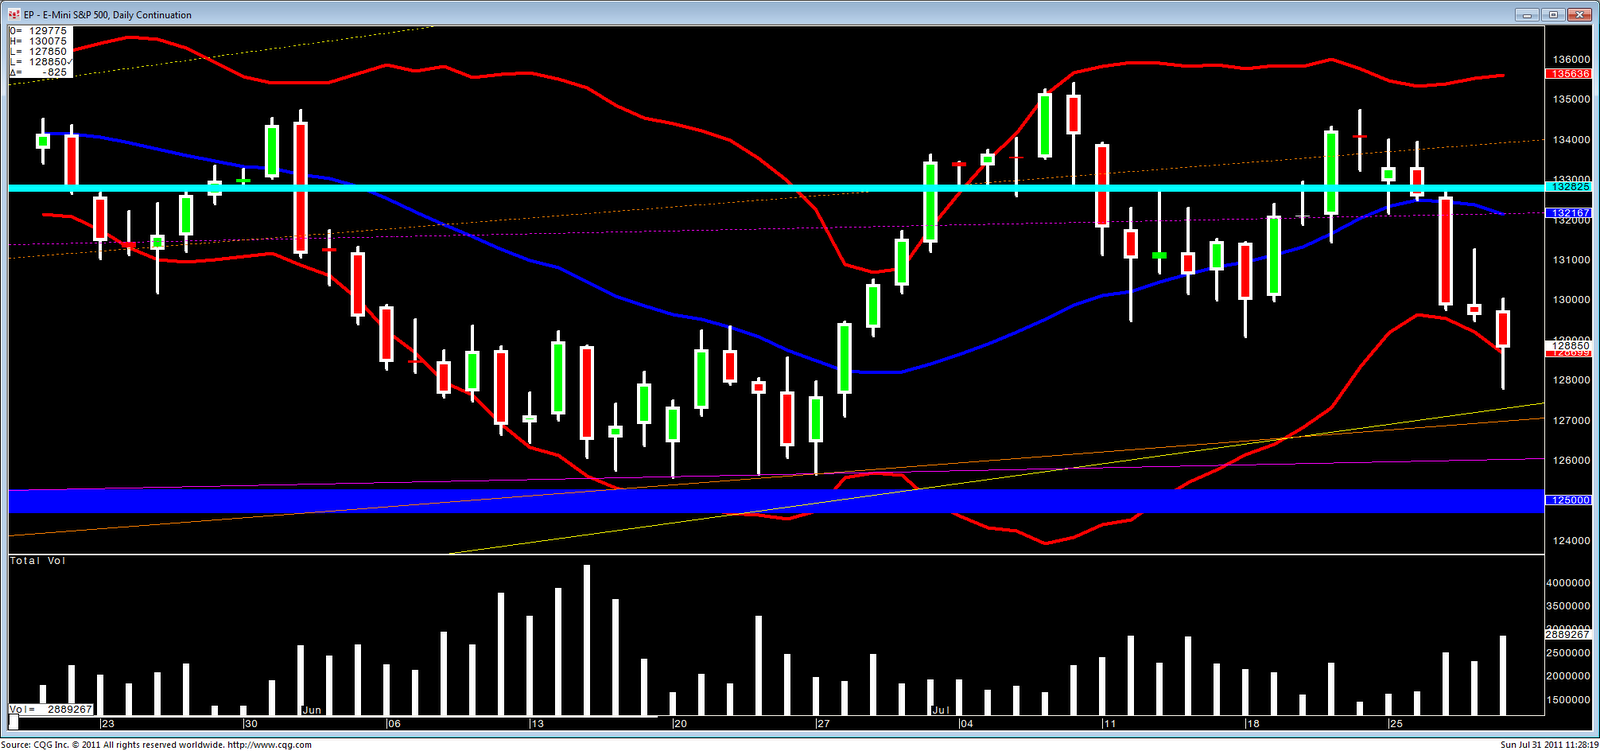


(Chart 1 - SNP Daily Extra Zoom)
(Chart 2 - SNP Daily Zoom)
(Chart 3 - SNP Daily )
Looking at the charts, I see 3 important bullish channels that can be governing current price. Using principles from the VSA bible "Master the Markets" (google it if you have never heard of it), and applying them to any of these channels, we can define the SNP as oversold.
This is bullet point number 1. We can further our bullish case by looking at the price action vs. volume on Friday. Although not a true hammer, we had price move well past the 2nd stnd. deviation (red Bollinger Band), and then close inside of it. This happened on far more volume than any of the previous days.
Based on this, and assuming this Debt Ceiling crap doesn't throw a giant curve ball in the next few days (which is a big "if" lol), I see this as a buying opportunity for a move up to the 1328 area.
Sorry for the Lapse in Coverage
Sorry for the absence guys...
Sandwich had some personal stuff to take care of and I was busy as hell at work.
However, we should be back to posting a few things a day going forward.
-Dolemite
Tuesday, July 19, 2011
Dollar Index (DX) Ascending Triangle 7/19

Crude Oil (CL) Target Reached 7/19

EDIT: An hour after this post crude formed a nice shooting star off the top trendline and I have exited my position. I might look to go short soon as well.
SnP Mini Future Daily Chart 6:45AM 7/19

 (chart 1 - snp daily chart zoomed)
(chart 2 - snp daily chart)
OK, here is the SNP 500 september future.
Price is bracketed between significant support and resistance.
We have support at 1295 (62% fib retrace of jun-jul rally and high of june chop/stall zone).
We have resistance at 1315-1309 (32% retrace of july selloff and prior shallow (32%) retrace of jun-jul rally) (also bottom of MML trading range at 1308.50)
I think we will get a close over/under this resistance/support in the next few days.
If it closes above resistance / below support, I think a 30 point move is feasible. (1345 or 1265)
I think we get a close over 1308 today and then go higher from here and test 1345
In the next few weeks, we may have a downside test of the longterm orange bullish channel (see chart 2 for scope of this channel). This has held for 2.5 years. If it breaks this, then the neckline of the head and shoulders sandwich is so fond of (search recent snp posts if curious) (also on my chart in white) comes into play.
Monday, July 18, 2011
Dollar Index (DX) Analysis 7/18
 (Chart 1 - Dollar Index Daily)
Globally, the USD is in an uptrend (orange channel). However, we are right in the middle right now.
75.75-76.00 is strong resistance.
We got above it last night/this morning, but are now almost back under it (currently 75.80)
If we close here or a bit lower, I think we retest 75 or possibly even 74.50. Long term I am a dollar bull as eventually I think we will test the highs of this orange channel... However with the recent price action, I think we get another 75 test before we break out to new recent highs.
EUR/USD Approaching key resistance 7/18

S&P (ES) Breaks 1 support, 1 to go 7/18

Crude Oil (CL) Lower end of channel

Daily and Weekly Gold Chart Analysis 7/18

 (Chart 1 - Gold Daily)
(Chart 2 - Gold Weekly)
1600 has fallen, like so many psychological resistances of the past in gold.
We are currently trading 1601.
Here is my "intelligent" commentary:
The orange daily/weekly uptrend is very well defined.
We are at the upper 1/4 of it currently (high is 1629 today)
Gold faces significant resistance at 1620-1640.
Gold faces significant resistance at 1620-1640.
Although I think it is still very bullish, it doesn't present trading value as a buy for me.
1620-1640 can be sold if hit today or tomorrow, but i would use low leverage/risk if at all.
Regardless if you look to enter a sell, or a pullback buy, wait for 60 min candle confirmation before entering a trade!!!
Daily and Weekly Silver Chart Analysis 7/18


(Chart 1 - Daily Silver)
(Chart 2 - Weekly Silver)
The daily chart is starting to look parabolic again.
I expect some selling to occur if we get higher, into the 42-44 area.
However, as strong as this rally looks, we could rip right past it.
From a trading standpoint:
I feel good about buying dips into the 38 area. I would target 42 initially, but would keep some on for 43.75, or 45.30 if you are feeling lucky ;)
I feel good about buying dips into the 38 area. I would target 42 initially, but would keep some on for 43.75, or 45.30 if you are feeling lucky ;)
Much less confidently, I would also look to sell the 42-43.5 area if we hit it in the next 2 days.
For both of these though, I would first look for 60 min candle confirmations, (hammers/shooting star or engulfing patterns) before entering a position.
Thursday, July 14, 2011
USDCHF **REQUEST** 7/14

GBPNZD **REQUEST** 7/14

Wednesday, July 13, 2011
Deere & Co (DE) **REQUEST** 7/13

Tuesday, July 12, 2011
EURUSD at Good Spot to Sell? 12:45 PM CST 7/12
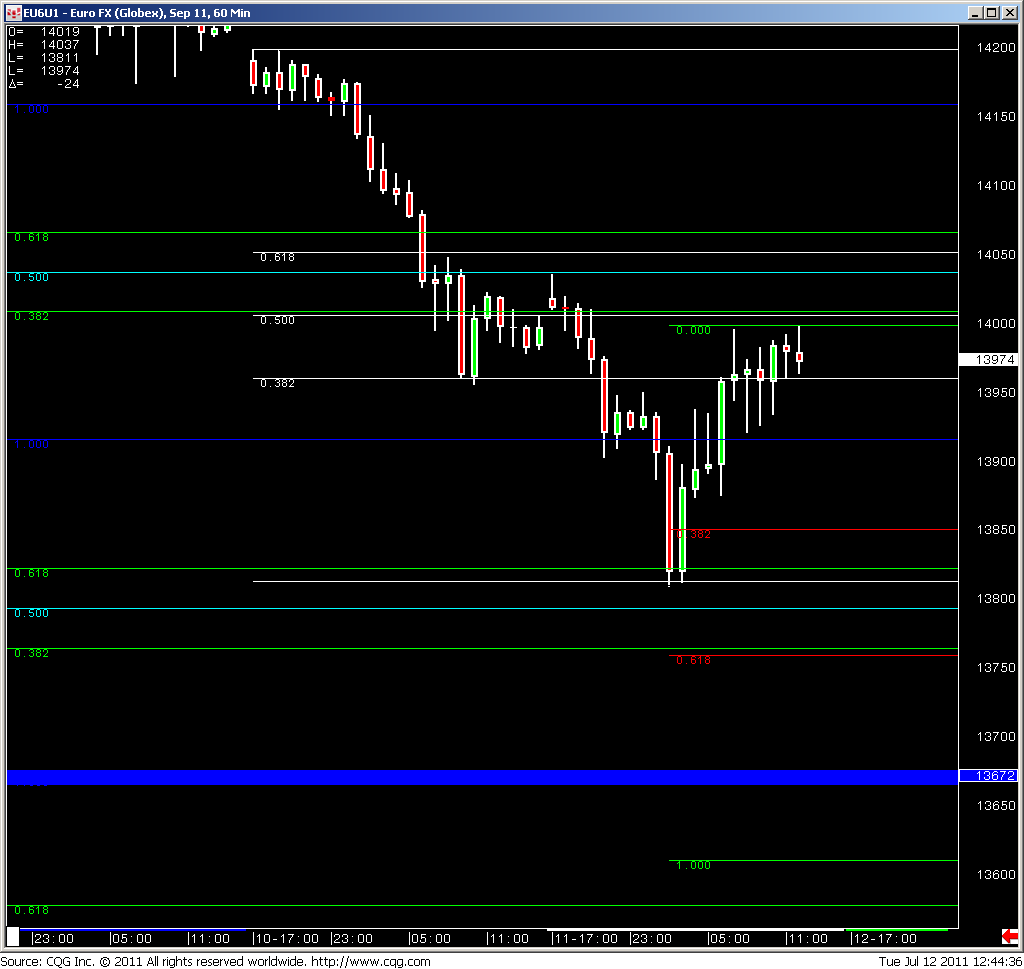 Here is a 60 min chart of the EURUSD future
Opened the week at 1.42, sold as low as 1.38 at night, now we are back at 1.40. You don't have to be a rocket scientist to figure out that it has retraced 50% of its move at this point. Combine that with some resistance just above 1.40, and further combine that with some high wick low body candles indicating selling in this area, and you have a compelling case to sell.
I sold 1.40 with a 1.41 stop.
My conservative target is 1.3775
My conservative target is 1.3775
Aggressive target is 1.3625
S&P (ES) Retracing 7/12

 To the left is the hourly chart of the S&P futures and below is the weekly chart. In the hourly we can see that we broke the key level of 1300 overnight only to spring back. It looks like we are in the middle of a retracement that might be stalling out here as we hit the first level. There has been a healthy pullback in the MACD histogram as well and while there is no real indication this level will hold, I think that we will see this head lower in the next day or so. The second chart is more of an update on a post earlier about a potential head and shoulders setup for ES on the weekly chart. Last week finished well for this setup and this week has started out with a bang as yesterday saw quite the sell off. I think more and more we are confirming this setup and the next test will be at the neckline around 1255 level.
Good Entry to Sell WTI Crude? 9:25 AM CST 7/12
 Here we have a 15 minute crude chart.
Crude is back at its 95 resistance.
The last 15 min bar was a strong shooting star right off of the resistance.
We also have hidden divergence with the MACD and price (see the white sloping line on MACD and price) which is confirming this peak might be a peak.
Further confirmation is the relatively high volume that bar had as well.
I sell here (95) stop at 96 and target 92.25
EDIT: Stopped out for .2% of account lost. Will stay on the crude sidelines for now
Gold Triple Top with Strong MACD Divergence. Sell? 6:55 AM CST 7/12
 Gold looking very toppy right now as the USD continues its tear to the upside.
Since Jun 6th, Gold has formed 3 separate shooting star reversals at the highs of the range (1550-1560). Each of those peaks have been confirmed with a lower and lower MACD value each time (see downsloping white line on MACD).
Couple a triple top, with strong MACD divergence, and thrown in that it is at the top portion of the channel it is in (light blue), and gold smells like a good risk reward for a sell here.
I sell here (1550) with a stop of 1565 and a target of 1505 (45:15 aka 3:1 reward:risk)
EDIT Stopped out
Friday, July 8, 2011
Silver (SI) Selling Opportunity 7/8

EUR/USD Triangle 7/8

Thursday, July 7, 2011
Natural Gas ETF (UNG) Channel Break **REQUEST** 7/7

Wednesday, July 6, 2011
Dolemite out until next week
Flattening up and heading out of town til Sunday
Sandwich will be posting updates when he gets time
Good luck and see you all next week.
Treasuries (TLT) Ready to resume trend 7/6

Platinum (PL) Finding Resistance 7/6

Russell 2000 Looking Weak. 9:11 AM CST 7/6

(Chart 1 - Russell 2k Day Chart)
Nasdaq certainly doesn't look weak
Russell 2k is generally a leading indicator, so it is no surprise that if weakness shows itself, it would show first in the Rus.
Since the high at the beginning of May, we have been making lower highs and lower lows.
This most recent run up has been pretty epic and strong.
However, we are still lower than the last peak.
Halfway through today, there is a nice bearish engulfing candle forming.
Halfway through today, there is a nice bearish engulfing candle forming.
It happens to be forming off of 84.20, the bottom of the trading range, and a line of great resistance.
We also have the beginning of some hidden MACD divergence (white sloping lines)
If this keeps up, I think this could be a decent sell with a 78.20 target
BestBuy (BBY) **REQUEST** 7/6

Microsoft (MSFT) **REQUEST** 7/6

Silver Overbought and at Resistance. 7:55 AM CST 7/6

(Chart 1 - Silver Daily Chart)
So far it has done this.
Halfway through the day, 35.94 is proving to be strong resistance.
Not a bad place to sell here with a 32.80 target.
Stop if it closes over 36
Tuesday, July 5, 2011
S&P (ES) Head and Shoulders 7/5

Monday, July 4, 2011
WTI Crude Oil Analysis 9:00 PM CST 7/4


(Chart 2 - WTI Crude Daily)
Amazing that a line drawn between 11/17/2010 and 02/15/2011 would be relevant on 06/27/2011, but it was. This line is the low line of the bullish channel (light blue) drawn on the daily chart. Price broke out of this channel when it gaped up on 02/23/2011. After the May/Jun 2011 crushing, we got back inside it, and the recent low fell right into the low line, as we failed there, headed higher, and still haven't really looked back.
With this snapback rally of the last week, we are now also back inside the dominant bearish channel (magenta) as well. The current trading range is defined as 92.22-95.14.
With all of this out there, here is my analysis:
Price is very fair here according to both channels, and is neither overbought or oversold.
The upper wicks of the last 3 sessions (as well as this current one), suggest that the upper bounds of the trading range are being respected. Until we close over 95.20, I think crude can be sold with a target of 92.25. I would rather not touch it though, see what way it moves, then trade it from there.
Here is the "Crude choose your own adventure"
1. We respect 95.20 and head lower
- If we do this sooner rather than later, the low of the bearish magenta channel and the low of the trading range should support the selloff and attract buying. All of this being said, the light blue uptrend line, should still be considered the be all end all ultimate support for any buying.
2. 95.20 resistance does not hold and we head higher
-Even if number 1 occurs and we head lower, once that sell off is exhausted, the following analysis still holds. I expect crude in the next 2 weeks to close above 95.20. July 20th presents an interesting set of circumstances. On that day, $100, the top of the bearish magenta channel, and the top of the bullish blue channel will all align. This is extremely powerful, and any move into this range around that time should be sold with good confidence.
Silver to Move a Bit Higher Before Next Selling Opportunity. 8:30 PM CST 7/4


 (Chart 1 - Silver 60 min Zoom )
(Chart 2 - Silver 60 min)
(Chart 3 - Silver Daily Zoom)
(Chart 4 - Silver Daily)
Lots of charts. Lets get to it!
60 min silver shows that 33.80 will be a strong place to buy for the immediate term.
It is the top of the current lower trading range (33.40-33.77), as well as the deep 62% fib of the most recent up move (33.80).
Should this buy zone be violated in the next few days, 32.80 should provide very strong initial support
Any run up into the upper trading range (34.97-35.34), should be met with strong selling, as in a few days, it will also coincide with the top of the governing bearish channel (magenta on all charts)
Right now we are in the middle of the channel. "Master the Markets" VSA(volume spread analysis) says that the bottom quarter of a channel means it is oversold and the top quarter is overbought. I would like to see it more overbought/sold near probable support/resistance before I take any serious position. (p.s. if you aren't familiar with that book "Master the Markets," pick it up... highly advised for any trader)
Sunday, July 3, 2011
SNP Start of the Week Analysis. Preopen 7/3

 (Chart 1 - SNP Daily Zoomed)
(Chart 2 - SNP Daily)
Wow, what a short covering rally. Every day took out resistance after resistance, as the shorts fell over each other to get out of their positions and start the long weekend.
That being said, it is now approaching a likely stall zone.
1345-1350 (in the september snp mini future contract on the CME) is setting up to be an area of superior resistance.
1347.5 is a 5/8 M.M. line and the top of this sector's trading range.
We also have the low of an old and very strong bullish channel (light blue) that we broke out of on Jun 1st. If we rally into it, it should provide a good place to sell.
As you can see, both of those intersect for the Monday session.
As you can see, both of those intersect for the Monday session.
I anticipate we will rally into it, and probably past it a bit.
When we get near it, look at 30/60 min charts for price action to indicate strong selling is indeed occurring at these levels (shooting stars, bearish engulfing, etc). If it is, I advise getting on board.
Friday, July 1, 2011
Precious Metal Long opportunity 7/1

 To the left are 4 hour charts of both gold and silver futures (GC & SI). It looks like both charts are starting to form hammers off of previous low peaks (not exactly but close). along with both of them showing some good divergence, especially in gold. I think this could be a good time to get in on these and I finally found a play I like after most stuff has been going against its recent trend and not much opportunity to get in. Contrary to popular belief, we have not quit the blog, but when I don't see good entries or spots I like, I tend to just not post as appose to spew BS about indecisiveness. So if you see little activity on the blog its probably cause the market is choppy or starting a new trend and I dont see a good entry spot.
Tuesday, June 28, 2011
Dollar Index (DX) Important Support 6/28

WTI Crude Oil Rejecting 92.25 Key Resistance. 10:05 AM CST 6/28

 (Chart 1 - WTI Crude 60 min)
(Chart 2 - WTI Crude Daily)
92.25 is a very important level. Today we rallied into 92.19 and couldnt get over it.
Last few hrs on the 60 min chart have very long upper wicks on the candles when it gets near 92.25, indicating continued selling interest at that level.
On the daily chart, 92.25 is also near the low line of the old bearish channel we were in (magenta channel).
I shorted oil here and look for a move back to 90 initially and ultimately a target of 87.50 is very feasible.
Subscribe to:
Posts (Atom)