Tuesday, July 12, 2011

EURUSD at Good Spot to Sell? 12:45 PM CST 7/12

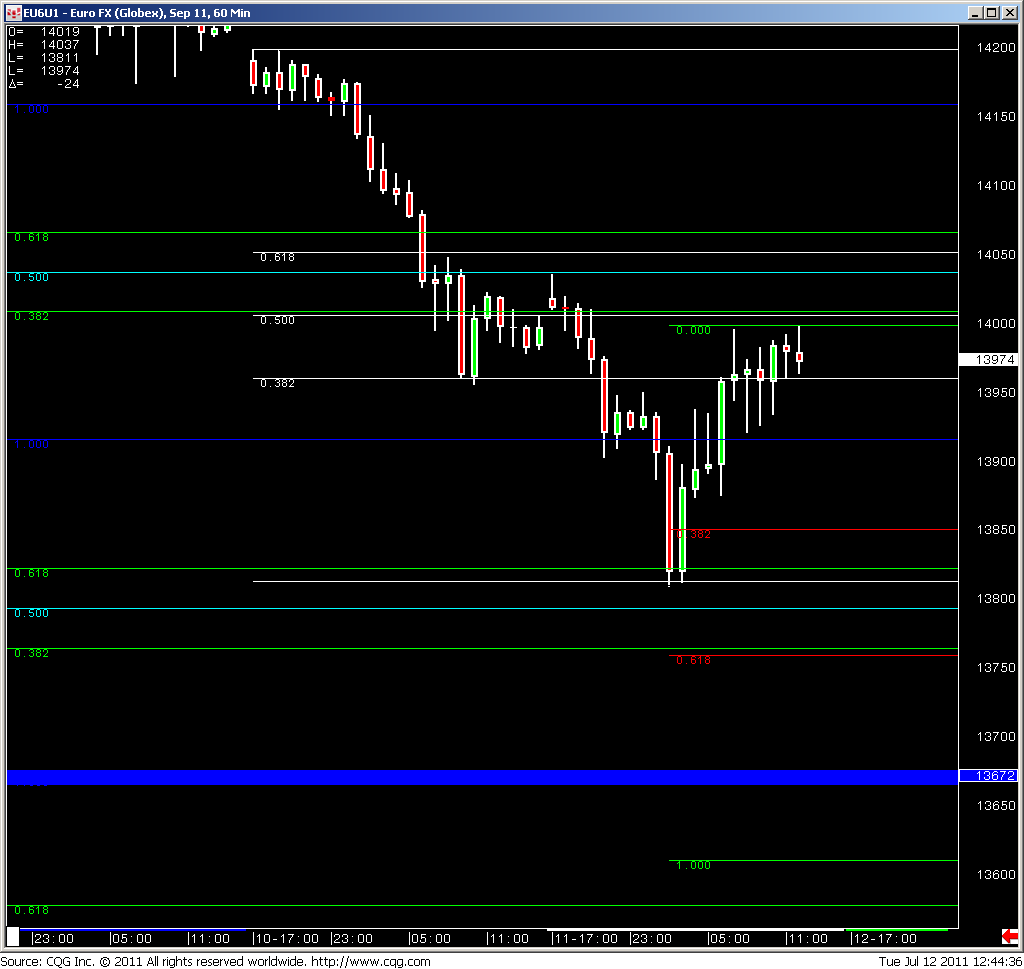
Here is a 60 min chart of the EURUSD future

Opened the week at 1.42, sold as low as 1.38 at night, now we are back at 1.40. You don't have to be a rocket scientist to figure out that it has retraced 50% of its move at this point. Combine that with some resistance just above 1.40, and further combine that with some high wick low body candles indicating selling in this area, and you have a compelling case to sell.

I sold 1.40 with a 1.41 stop.
My conservative target is 1.3775
Aggressive target is 1.3625

S&P (ES) Retracing 7/12

To the left is the hourly chart of the S&P futures and below is the weekly chart. In the hourly we can see that we broke the key level of 1300 overnight only to spring back. It looks like we are in the middle of a retracement that might be stalling out here as we hit the first level. There has been a healthy pullback in the MACD histogram as well and while there is no real indication this level will hold, I think that we will see this head lower in the next day or so. The second chart is more of an update on a post earlier about a potential head and shoulders setup for ES on the weekly chart. Last week finished well for this setup and this week has started out with a bang as yesterday saw quite the sell off. I think more and more we are confirming this setup and the next test will be at the neckline around 1255 level.

Good Entry to Sell WTI Crude? 9:25 AM CST 7/12

Here we have a 15 minute crude chart.

Crude is back at its 95 resistance.
The last 15 min bar was a strong shooting star right off of the resistance.

We also have hidden divergence with the MACD and price (see the white sloping line on MACD and price) which is confirming this peak might be a peak.

Further confirmation is the relatively high volume that bar had as well.

I sell here (95) stop at 96 and target 92.25

EDIT: Stopped out for .2% of account lost. Will stay on the crude sidelines for now

Gold Triple Top with Strong MACD Divergence. Sell? 6:55 AM CST 7/12

Gold looking very toppy right now as the USD continues its tear to the upside.

Since Jun 6th, Gold has formed 3 separate shooting star reversals at the highs of the range (1550-1560). Each of those peaks have been confirmed with a lower and lower MACD value each time (see downsloping white line on MACD).

Couple a triple top, with strong MACD divergence, and thrown in that it is at the top portion of the channel it is in (light blue), and gold smells like a good risk reward for a sell here.

I sell here (1550) with a stop of 1565 and a target of 1505 (45:15 aka 3:1 reward:risk)

EDIT Stopped out