

(Chart 1 - SNP Daily Extra Zoom)
(Chart 2 - SNP Daily Zoom)
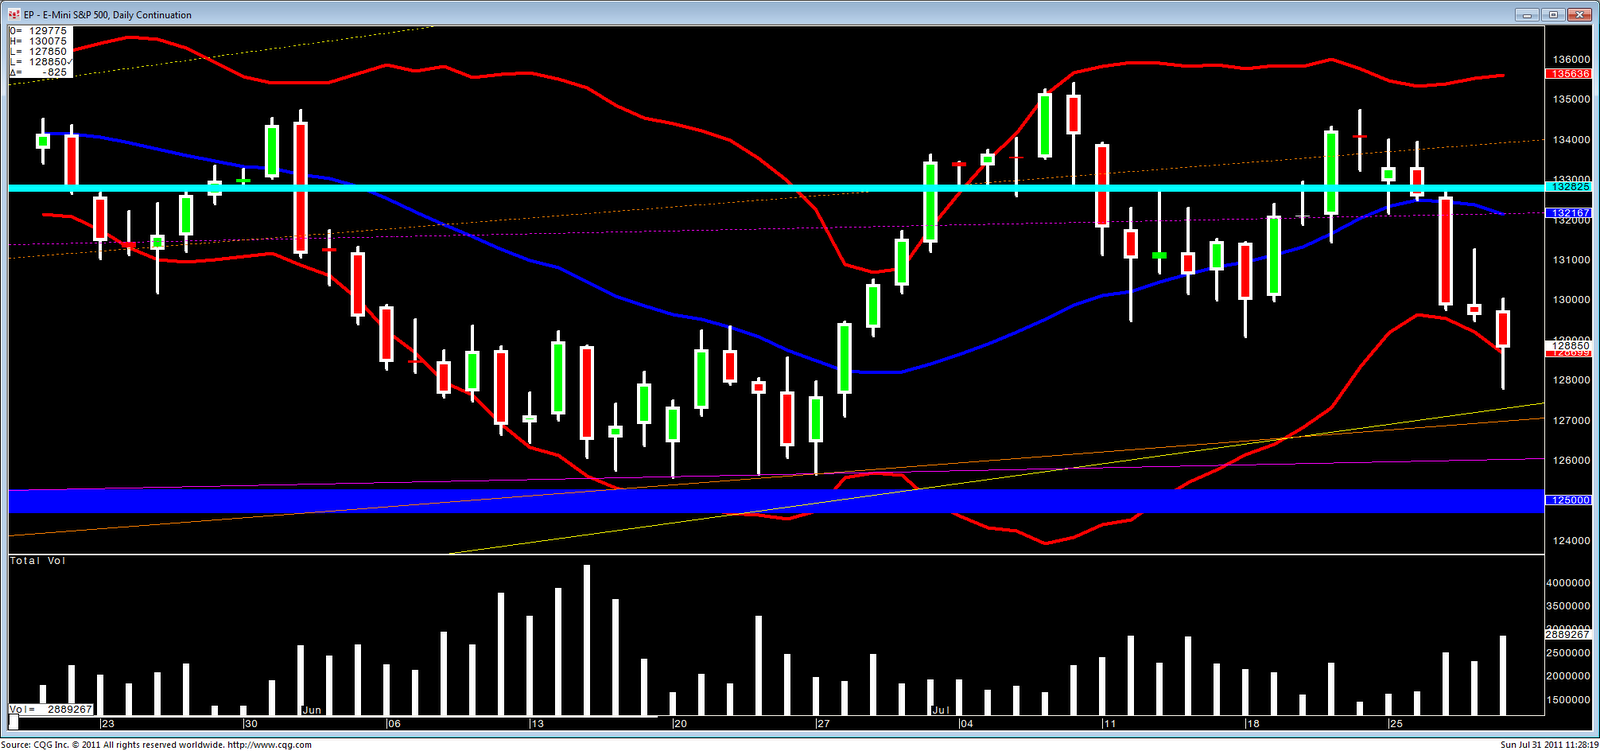
(Chart 3 - SNP Daily )
Looking at the charts, I see 3 important bullish channels that can be governing current price. Using principles from the VSA bible "Master the Markets" (google it if you have never heard of it), and applying them to any of these channels, we can define the SNP as oversold.
This is bullet point number 1. We can further our bullish case by looking at the price action vs. volume on Friday. Although not a true hammer, we had price move well past the 2nd stnd. deviation (red Bollinger Band), and then close inside of it. This happened on far more volume than any of the previous days.
Based on this, and assuming this Debt Ceiling crap doesn't throw a giant curve ball in the next few days (which is a big "if" lol), I see this as a buying opportunity for a move up to the 1328 area.
No comments:
Post a Comment