Friday, May 27, 2011

Equities volume analysis 5/27


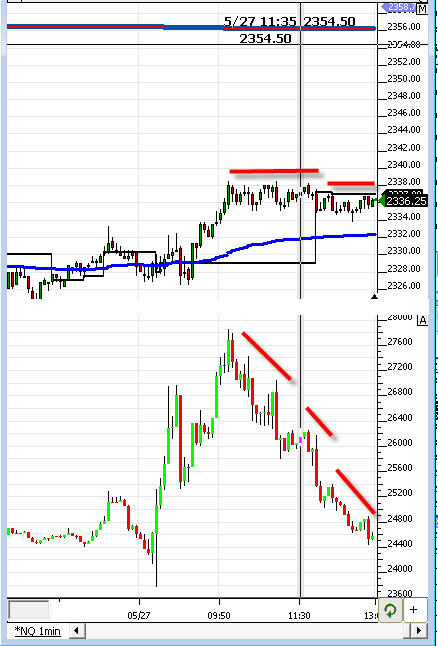
Here it is, my first ever blog posting as requested! :) Again the Delta Vol shows continue selling on both index. This is why I am still bearish from my inital positon on the russell at 838.40. Of course as everyone know, using vol analysis for your trading can change at anytime when supply and demand comes in. You do not know when but you need to be able to react to it quickly. As of right now, I am still bearish and think this morning was a mark up. Of course this can change if Vol picks up or the bears give up near end of day, but hints of it will show up in the chart. I hope this help. I'm just playing the odds and managing my risk with a trailing stops. FYI... i hate this market btw with the FED being involved. Its not the same anymore these day...... good luck!


PS: Since this is my first ever post, I had to remove some charting items for legal purpose. Just being truthful just in case one of you ask. :)


Nasdaq (NQ) Intra-day report 5/27

It looks like today will be the make or break for being short equities. As we watch the nasdaq break out of its downward trend, crack its first retracement and look to head north into a long weekend, there doesn't seem to be much hope. I think the only thing that would make me feel comfortable going into the weekend short would be an afternoon sell off that sees us below the purple trend line and the 38% retracement. There is a little hope of this as we can see some divergence with the MACD forming (highlighted by the yellow trendlines), which at this point if it did sell off would be triple divergence. Most likely I will be out of this trade by the end of the day for a small loss but will update at the end of the day.

WLT Walter Energy update 5/27

On 5/24 I offered Walter Energy (WLT) as a great trade opportunity as it formed a hammer on good volume off great support. So far if you got in this trade in the 115-120 level you have been rewarded the last three days as we push into the 125 level and its first real test to the upside. If you happen to load up then this is a good opportunity to maybe consider taking a small quantity off. Still feeling this ends up back in the 135-140 range, and have targeted my position as such.

Euro bumping on trendline 5/27

The dollar has been getting absolutely rocked, with only a small dead cat bounce yesterday off some support. With that comes the euro gaining quite a bit, and heading towards a forming trendline. I think at this point it might be ill advised to enter a short here unless you get some sort of candlestick formation or other signal that this trendline might hold. I think though you might be able to make a good play back to the trendline in yellow if you're scalping intra-day. Otherwise on a daily type position I think it would be wise to stand clear until this picks a direction and not enter anything heading into the long weekend ahead.

Edit: The awful housing number that just came out seems to have maybe given us an engulfing pattern to look into selling the euro here for at least a small gain.

Corn (ZC) Second opportunity? 5/27

After talking about corn earlier this week as a potential buy if we could see it pull back to the 717-715 level, it seems it decided to atleast for the moment bounce off the first retracement (@731). But with the shooting start formed yesterday, if we see a break of yesterdays lows I could see it heading right back towards my targeted entry aread over the next couple days. Otherwise if it doesn't, Tuesday might have been your best opportunity to get into this trade.

Thursday, May 26, 2011

Nasdaq Constant Volume Bar 8:15PM CST 5/26


If you follow this, you know I am bearish the Nasdaq. See any of my recent posts such as this one. I will be the first one to tell you when I am wrong on something I said. I post all my pukes and make no bones about any of it...

That being said, I am still short this fucker and still think it is ripe to fall. I sound like a broken record, but sometimes you have to trust what you know to be right. Lets go to this constant volume chart (which plots each bar as the range price traded in for 5,000 contracts).

We have a confluence of resistance at the 2330-2340 area:
-Top of current magenta dominant bearish channel
-Bottom of old dominant orange bearish channel
-38% shallow Fib from May 2 highs to recent May 24th lows

If we can get above both of the aforementioned channel lines, I will wave the white flag.
Until then, I am holding.

WTI Crude Between a Rock Support and a Hard Resistance 8:00PM CST 5/26


Using a "constant volume bar" study (which plots each bar as the range price traded in for 10,000 contracts to trade), we have the following chart. We can see that the midpoint of the blue bullish channel has been an important level. The top of the bearish magenta channel is also key. These 2 levels are colliding in the next few 10k trades. Just underneath is $100, which as you can see has been very important as well.

I scratched my sell at $100 and am waiting to see how price breaks out of the current triangle it is in. I am betting on supply coming in at the top of the triangle and crushing it through $100, but time will tell.