Showing posts with label snp. Show all posts

Sunday, July 31, 2011

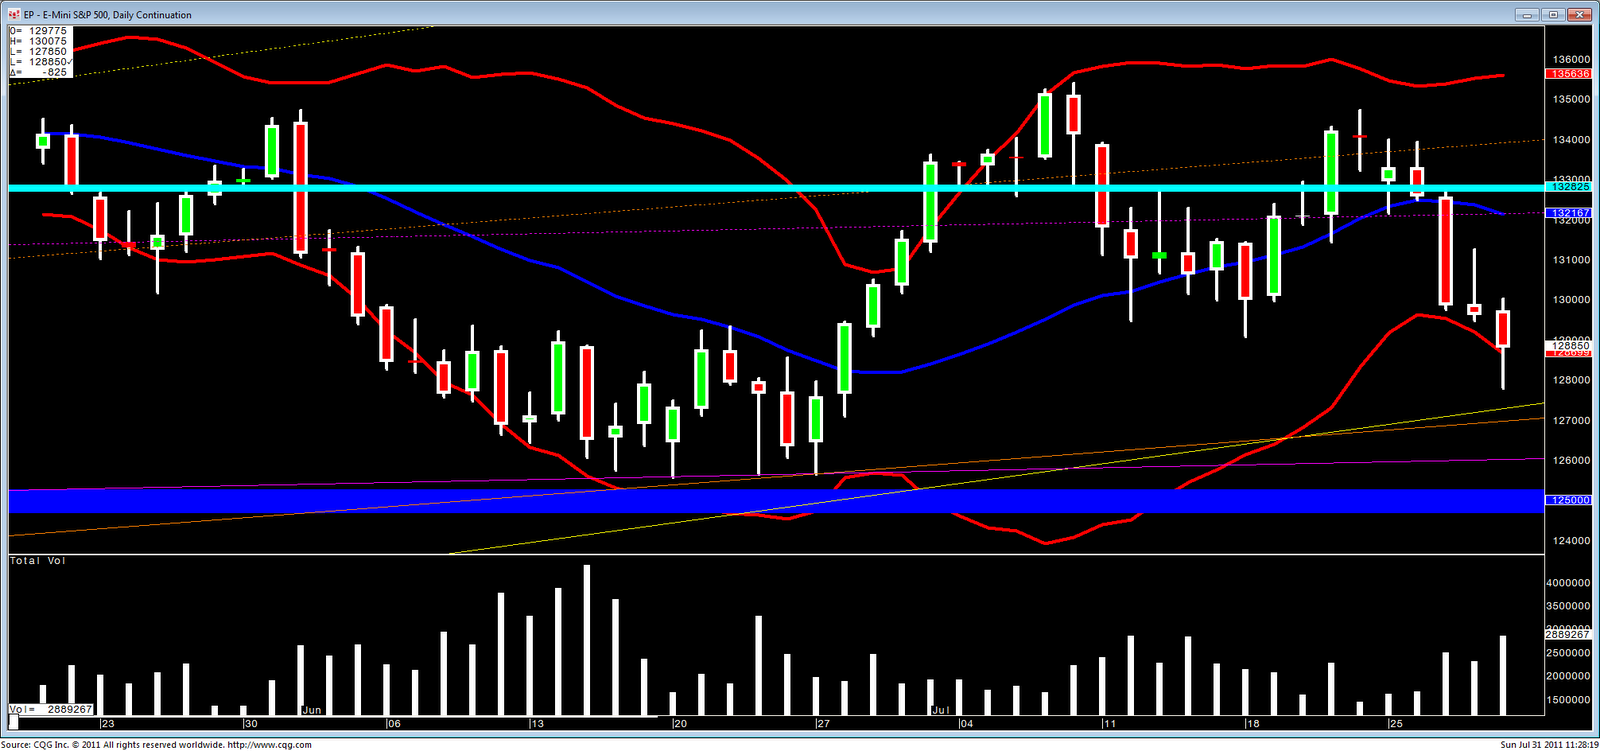
SNP Look at the Week Ahead 7/31


(Chart 1 - SNP Daily Extra Zoom)
(Chart 2 - SNP Daily Zoom)
(Chart 3 - SNP Daily )

Looking at the charts, I see 3 important bullish channels that can be governing current price. Using principles from the VSA bible "Master the Markets" (google it if you have never heard of it), and applying them to any of these channels, we can define the SNP as oversold.

This is bullet point number 1. We can further our bullish case by looking at the price action vs. volume on Friday. Although not a true hammer, we had price move well past the 2nd stnd. deviation (red Bollinger Band), and then close inside of it. This happened on far more volume than any of the previous days.

Based on this, and assuming this Debt Ceiling crap doesn't throw a giant curve ball in the next few days (which is a big "if" lol), I see this as a buying opportunity for a move up to the 1328 area.

Tuesday, July 19, 2011

SnP Mini Future Daily Chart 6:45AM 7/19


(chart 1 - snp daily chart zoomed)
(chart 2 - snp daily chart)

OK, here is the SNP 500 september future.
Price is bracketed between significant support and resistance.

We have support at 1295 (62% fib retrace of jun-jul rally and high of june chop/stall zone).
We have resistance at 1315-1309 (32% retrace of july selloff and prior shallow (32%) retrace of jun-jul rally) (also bottom of MML trading range at 1308.50)

I think we will get a close over/under this resistance/support in the next few days.
If it closes above resistance / below support, I think a 30 point move is feasible. (1345 or 1265)
I think we get a close over 1308 today and then go higher from here and test 1345

In the next few weeks, we may have a downside test of the longterm orange bullish channel (see chart 2 for scope of this channel). This has held for 2.5 years. If it breaks this, then the neckline of the head and shoulders sandwich is so fond of (search recent snp posts if curious) (also on my chart in white) comes into play.

Monday, July 18, 2011

S&P (ES) Breaks 1 support, 1 to go 7/18

To the left is the hourly chart of the s&p. This morning it looks like we have finally broken the 1300-1303 level which had been providing a major support (except the brief break last week). I posted a couple weeks ago that I thought a nice head and shoulder formation on the weekly chart was in progress and have been short since then. So far so good, but it will be important to see how the S&P reacts to breaking this support and see if it can hold when it gets retested from below. We can also see we held the deep retracement at 1291 shown in red, and will need to eventually break this last retracement and previous high peak in order for this to continue to our eventual neckline around 1255-1260.

Tuesday, July 12, 2011

S&P (ES) Retracing 7/12

To the left is the hourly chart of the S&P futures and below is the weekly chart. In the hourly we can see that we broke the key level of 1300 overnight only to spring back. It looks like we are in the middle of a retracement that might be stalling out here as we hit the first level. There has been a healthy pullback in the MACD histogram as well and while there is no real indication this level will hold, I think that we will see this head lower in the next day or so. The second chart is more of an update on a post earlier about a potential head and shoulders setup for ES on the weekly chart. Last week finished well for this setup and this week has started out with a bang as yesterday saw quite the sell off. I think more and more we are confirming this setup and the next test will be at the neckline around 1255 level.

Tuesday, July 5, 2011

S&P (ES) Head and Shoulders 7/5

To the left is a weekly chart of the S&P (ES). It might be a little early, but it looks like we could be forming a head and shoulders pattern. While this could easily be invalidated by weeks end with a weekly close near 1350 or so, I think at the moment it is looking good. If we see a week that closes near 1335 or lower I think we could be heading to the neckline shown in green and a possibly valid H&S pattern completion. The volume has been near the lows as appose to the highs which all show relatively light volume. We have also seen divergence with the MACD throughout the formation. I think a sell here could be low risk, or a sell if we break the neckline. The ultimate target would end up being around 1150 for this pattern, but more on that if this pans out over the next week or two.

Sunday, July 3, 2011

SNP Start of the Week Analysis. Preopen 7/3


(Chart 1 - SNP Daily Zoomed)
(Chart 2 - SNP Daily)

Wow, what a short covering rally. Every day took out resistance after resistance, as the shorts fell over each other to get out of their positions and start the long weekend.

That being said, it is now approaching a likely stall zone.
1345-1350 (in the september snp mini future contract on the CME) is setting up to be an area of superior resistance.
1347.5 is a 5/8 M.M. line and the top of this sector's trading range.
We also have the low of an old and very strong bullish channel (light blue) that we broke out of on Jun 1st. If we rally into it, it should provide a good place to sell.

As you can see, both of those intersect for the Monday session.
I anticipate we will rally into it, and probably past it a bit.
When we get near it, look at 30/60 min charts for price action to indicate strong selling is indeed occurring at these levels (shooting stars, bearish engulfing, etc). If it is, I advise getting on board.

Monday, June 27, 2011

S&P (ES) At trendline 6/27

S&P hourly chart is approaching the trendline that was set by the last couple days of action (shown in yellow). We also see we are right at the deep retracement (@1279.75) for our recent down move from the peak wednesday at 1294. Any good formation here and I think it would make for a good selling opportunity, although with such easy resistance found I would not be shocked to see big players push this higher only to see it fall right through the trendline later.


EDIT: Not mentioned in the post or shown in the chart is the fact that the MACD has pulled back to the same height as the previous peak from Friday, while price is a good 5 points lower, not a crazy amount of divergence but there is some.

Thursday, June 23, 2011

S&P (ES) Holds intraday resistance 6/22

After a hard sell off overnight and into the morning session, the S&P has pulled back a good bit from the lows to find its intraday resistance at 1268-1271 range. You can see this is the confluence of the two retracements drawn in purple and yellow. We were forming a nice shooting star through both these levels until the last minute of the hour bar shot up and kinda screwed that up, but I think we still head lower to end the session and back towards the lows.


EDIT: Of course with good greece news breaking right before the close, this doesn't seem like it will sell off to the lows. I have exited my short positions and will let this play out and find a new setup.

Wednesday, June 22, 2011

SnP Resistance Overhead. 6:09 PM CST 6/22

(Chart 1 Daily SnP future)

Sandwich did a post not too long ago here on the SnP as well, but I wanted to get my 2 cents in.

1279.5-1299 is the "trading zone" in MML theory. Essentially, it is hard for price to get in there, and once it is in there for 5 or so days it is hard to get out.

I believe that shorting this area for a move down to 1250 (whose speed is governed by the slope of the bottom of the magenta trend channel) will be a good trade.

A close with any conviction over 1300, and I begin to get bullish however.

S&P (ES) Muddles around resistance, holds 6/22

The S&P hourly chart on the left has been a little worrisome for anyone short the last couple days, and as I had warned in a post a few days ago I thought that we would ultimately reach 1288-1290 before having a chance to head back down. So after hovering around this resistance which was tested a couple other times, but not at all since marking its relative low at 1252.25, we finally start to sell off and seem to have held it. If you had shorted at this level I think it can be held for more opportunity, but if we head back up to 1288-1290 tomorrow I would be weary and ready to get out.

Thursday, June 16, 2011

SnP Chart 1270-1280 Should be Sellable Levels. 6:51 PM CST 6/16


(Chart 1 - Daily SnP Zoom)
(Chart 2 - Daily SnP)

The number 1 thing I am looking at is the bottom line of the magenta bearish channel we broke out of towards the beginning of June. As long as we stay below it, I am a bear. Sure there will be bounces, but you will use those to sell into now.

1269.5 is minor resistance. I am going to fade into a short position there, but save bullets for:

1279.5 is very important resistance. It is also right about where this line I talked about earlier is currently in space. If we get at or just above this line, I look to reshort for a move down to 1250.

Should we get down there I will take a good chunk off, as we could bounce to the magenta down trend line again. Eventually, I see us cracking 1250 for an initial test of 1230.5. From there any bounce to 1250 can be sold with pretty solid confidence. (but I am getting ahead of the market haha)

Wednesday, June 15, 2011

S&P (ES) Bouncing off trendline 6/15

The hourly chart formed a trendling (shown in green) from two previous peaks on this march downwards over the last week. After yesterdays break above this and then break below it this morning, we are now testing it on the downside. I think this will be an important area to hold to determine that we continue down today and the next couple days. If you are looking to get short its as good of place as any.

Tuesday, June 14, 2011

Snp, Gold, Oil, Silver, All at Key Resistance 9:20 AM CST 6/14

Quick update

Snp september future currently 1281
WTI currently 98.15
August gold currently 1523
July silver currently 35.19

All of these are either just under/over or at very important resistance.
I resold all of them.
Any real move higher from here and I will have some serious thoughts about staying short.

SNP Finishing a Dead Cat Bounce. 1279 Key Resistance. 7:16 AM CST 6/14


(Chart 1 - Snp September future 30 min chart)
(Chart 2 - Snp September future daily chart)

The SnP broke out of its daily bearish channel (magenta) Jun 6th.
Now the bottom of that is important resistance, and personally I don't see us closing back in it.
1279.25 is also very very important. Look at the 30 min chart with the tall upside wicks on the recent candles that are near this area. This shows others are selling here too.

If we run up into 1277-1280, I like the sale for a move down to 1250.


Thursday, June 9, 2011

S&P (ES) Re-entry opportunity 6/9

Anyone who has followed this blog in the least bit knows that me and Dolemite have been shorting the equities quite a bit, and it looks like another opportunity to get in is coming via the S&P index. We see a retrace today heading us towards the all important 1290 area, as the bottom of an important retracement channel and some previous peaks and valleys. It looks like the MACD is providing some continuation divergence between today and Tuesday's highs to boot. Also to note is the extremely low volume today (shown in light blue below the candles) compared to the volume for the down days. Any signal, such as the shooting star forming now, and I think its sell sell sell.

Edit: To note, you can see my charting application has actually switched front months to the Sep contract, but the Jun contract is also quite low in volume and is already at the 1290 level, with highs at 129300.

Tuesday, June 7, 2011

Nasdaq (NQ) S&P (ES) Dead Cat Bounce? 6/7

It looks like both the nasdaq and s&p are working on a dead cat bounce off a hard sell off yesterday (also the other US equity indexes, just not shown). We see they are approaching important previous low's and bottom of the up move's retracement channel shown in purple (shown on a daily chart in my previous post) We also see continuation divergence between price and the MACD in both charts shown by the yellow trend lines. I think these levels are important to stop at if these markets are to continue down right now, otherwise a retrace of last weeks sell off might be in order.

Monday, June 6, 2011

Nasdaq (NQ) S&P (ES) Important support 6/6

Both the nasdaq and s&p are coming up on important levels to break if this downtrend is to continue. Both fall at their 61.8% retracement, shown in purple (@1291 ES, @2277 NQ), which also corresponds to two previous low peaks, one in early march and one in mid april. If we break through these levels, I feel it will be quick and probably will get a pullback this afternoon back to them before ultimately heading farther down. If you are bullish still in this market, this is as good of place as any to either pull of short positions or get long with minimal downside risk. I for one am keeping my shorts.

Sunday, June 5, 2011

SnP Daily Chart Weekend Look Ahead 6/5


(Chart 1 - SNP Daily Zoom)
(Chart 2 SNP Daily)

We finally broke out of the 1308.5-1347.75 trading range, closing at 1296.25.

This is significant support as it is the conflunce of:
-Bottom of current bearish channel (orange)
- 38% retrace (shallow Fibonacci) of Nov 2010 lows to May 2 high
-62% retrace (deep fib) of March 2011 "Japan" low to May 2 high

However, 1308.5 is now the ultimate resistance. (keep in mind they can exceed it by a few points intra day, but a close of 1310+ gives me serious pause about this downtrend continuing.)

Readers know, I have been short the last few days.
I covered a good chunk of my position towards the end of Friday.
I see us getting back up to 1305-1310 soon.
I will be using such pops to add to current shorts and target 1290 and ultimately 1273


Wednesday, June 1, 2011

SNP Wrapup 5:40 PM CST 6/1


(Chart 1 - Snp day chart zoom)
(Chart 2 - Snp day chart)

Wow... what a day.
We came up to 1348, hit the top of the trading range and the bottom of the very important old bullish channel, and fell like a stone.

2.67 million contracts traded across all SNP futures (On the very high side)
CNBC had to pull every excuse out of the 'o8 bag for why we were down.... (Can't be because stocks are shit and smart money is dumping...)

1346-1310 is the "trading range" of this area(1250-1406). When we are inside it, we want to stay there. When we are outside of it, we have a hard time getting back in. (This and a lot of these funky lines and grids are part of Murrey Math Lines, which you can Google. I have the book which has info not on any site or forum.)

That being said... we are at 1311 currently. I took a scratch on some of my shorts 3/4 of the way of that sell off. Still short quite a bit. I am looking for buying off the 1310 to push us up into the Asian and European sessions, maybe even the US. We have NFP Friday, so it might take the release of the jobs number to get us through this 1310, and will be a dead cat bounce from now until then... Just means I can sell some more ;)

Oh as for targets and contingencies.... If we crack 1310, 1290 is short term and 1250 is ultimate support. If we bounce from 1310 I am looking to sell 1327 and 1343 with a stop of 1350.

SNP Mid Day Update 7:00AM 6/1


(Chart 1 - Snp Daily Chart Zoomed)
(Chart 2 - Snp Daily Chart)

1310-1346 is the trading range.
The light blue up channel was the dominant S/R.
Now that we are out of it, we are back against the bottom of it, as well as the top of the trading range.

If we can close inside the blue channel, I am a buyer.
If we reject it and close inside of 1346, I am a seller.

Are the winds of change blowing? Or will it be more 2PM 10 point melt-ups?