Showing posts with label NQ. Show all posts
Wednesday, June 8, 2011
Nasdaq (NQ) holding resistance turned support 6/8
the Nasdaq index on Monday broke what looks like very strong support around the 2278 mark. It was almost certain we would at least come back and test it going up before heading further, and the question was would be if it could hold and keep us moving down over the next couple days and it looks like it clearly has. We are now quickly moving past this level and if we close near lows today, I see no where for it to stop till we get to the 2200 level
Tuesday, June 7, 2011
Nasdaq (NQ) S&P (ES) Dead Cat Bounce? 6/7
It looks like both the nasdaq and s&p are working on a dead cat bounce off a hard sell off yesterday (also the other US equity indexes, just not shown). We see they are approaching important previous low's and bottom of the up move's retracement channel shown in purple (shown on a daily chart in my previous post) We also see continuation divergence between price and the MACD in both charts shown by the yellow trend lines. I think these levels are important to stop at if these markets are to continue down right now, otherwise a retrace of last weeks sell off might be in order.
Monday, June 6, 2011
Nasdaq (NQ) S&P (ES) Important support 6/6
Both the nasdaq and s&p are coming up on important levels to break if this downtrend is to continue. Both fall at their 61.8% retracement, shown in purple (@1291 ES, @2277 NQ), which also corresponds to two previous low peaks, one in early march and one in mid april. If we break through these levels, I feel it will be quick and probably will get a pullback this afternoon back to them before ultimately heading farther down. If you are bullish still in this market, this is as good of place as any to either pull of short positions or get long with minimal downside risk. I for one am keeping my shorts.
Tuesday, May 31, 2011
Equity Wrapup 5/31
Looking at the four equity markets (S&P, dow, nasdaq, and russell) we see that of these, only the russell actually broke a new major low peak (@813.4) in the last couple weeks, and the rest only seem to have made deep retracements. The russell is also the only one now that has firmly broken past the top level 61.8% retracement (@845) of this down move. The other three are either right at the top or still inside the major levels of the most recent move (all retracements shown in red on charts). It looks like barring a major reversal tomorrow (which is always possible), we are heading back to an uptrend in the equity market for the time being, with confirmation coming as all the markets break past 61.8% level or breaking new yearly highs. I'll go ahead and say it here that it might be time to BTFD if you haven't already.
Friday, May 27, 2011
Equities weekly wrap-up 5/27
I think since we've started this blog we have been advocating a short position in equities markets. While the last few days have not been kind after a good start to the week, I think there is strong evidence that there is nothing to panic about in all 4 markets. The retracements in yellow are the retracements of the last up move before the downtrend began, and all 4 markets broke below the lowest retracement level of these on Tuesday or Wednesday, indicating an end to the uptrend. We've also held the retracement for the most recent down move (in purple) in all 4 markets. As is the case most of the time, we leave into a long weekend with a lot of uncertainty sitting on important levels. All four markets sit at a confluence of retracements except the S&P. The Russell is the only one to break past the 38% retracement of the most recent downmove, but now sits at the 50% and also the most recent peak from last week. I think we look to continue the down swing on Tuesday, but any higher than we finished today and we might end up in a no trend area, which is always danger for swing traders.
Equities volume analysis 5/27

Here it is, my first ever blog posting as requested! :) Again the Delta Vol shows continue selling on both index. This is why I am still bearish from my inital positon on the russell at 838.40. Of course as everyone know, using vol analysis for your trading can change at anytime when supply and demand comes in. You do not know when but you need to be able to react to it quickly. As of right now, I am still bearish and think this morning was a mark up. Of course this can change if Vol picks up or the bears give up near end of day, but hints of it will show up in the chart. I hope this help. I'm just playing the odds and managing my risk with a trailing stops. FYI... i hate this market btw with the FED being involved. Its not the same anymore these day...... good luck!
PS: Since this is my first ever post, I had to remove some charting items for legal purpose. Just being truthful just in case one of you ask. :)
Nasdaq (NQ) Intra-day report 5/27
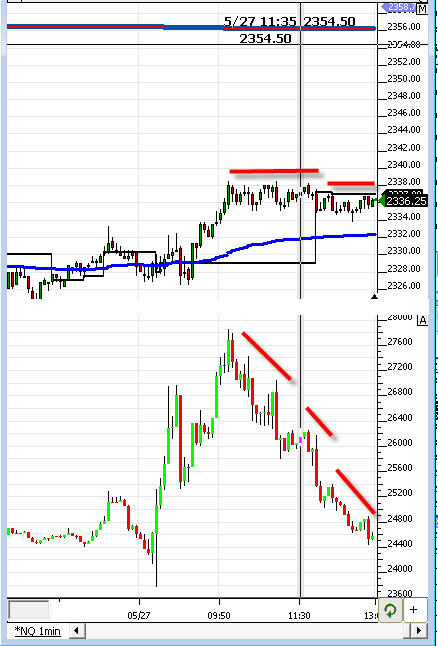
It looks like today will be the make or break for being short equities. As we watch the nasdaq break out of its downward trend, crack its first retracement and look to head north into a long weekend, there doesn't seem to be much hope. I think the only thing that would make me feel comfortable going into the weekend short would be an afternoon sell off that sees us below the purple trend line and the 38% retracement. There is a little hope of this as we can see some divergence with the MACD forming (highlighted by the yellow trendlines), which at this point if it did sell off would be triple divergence. Most likely I will be out of this trade by the end of the day for a small loss but will update at the end of the day.
Subscribe to:
Posts (Atom)